The goal of this project is to make a python code in combination with excel and other neccessary tools to retrieve tradingview data and use it to make BUY or SELL trading signals using the TRADINGVIEW_TA library. Once the final signals are calculated they will be sent to my e-mail so I can check the results of the data no matter where I am.
I was able to collect the data to Excel succesfully and played around with different indicator combinations to try to make a good signal to make more profitable trades. What ended up stoping me was that I was making too many requests per minute and my code started erroring out as my IP was getting blocked. So I found that I will need to use a different source for data collection that will support the volume that I am trying to collect – Binance.
Github link – https://github.com/Cadez123/Tradingview_analysis_22.6.2025
DETAILED DESCRIPTION
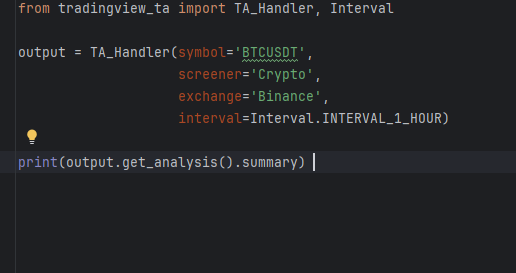
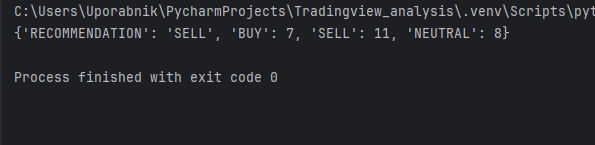
1. I found a very interesting python library called tradingview-ta. You can use this library to extract a lot of data for each trading instrument that is on tradingview. This code can collect about 35 indicators for each of these symbols for each timeframe on tradingview, which equates to a lot of useful data. On top of this it also returns a reccomendation, either BUY, STRONG_BUY, SELL, STRONG SELL or NEUTRAL.
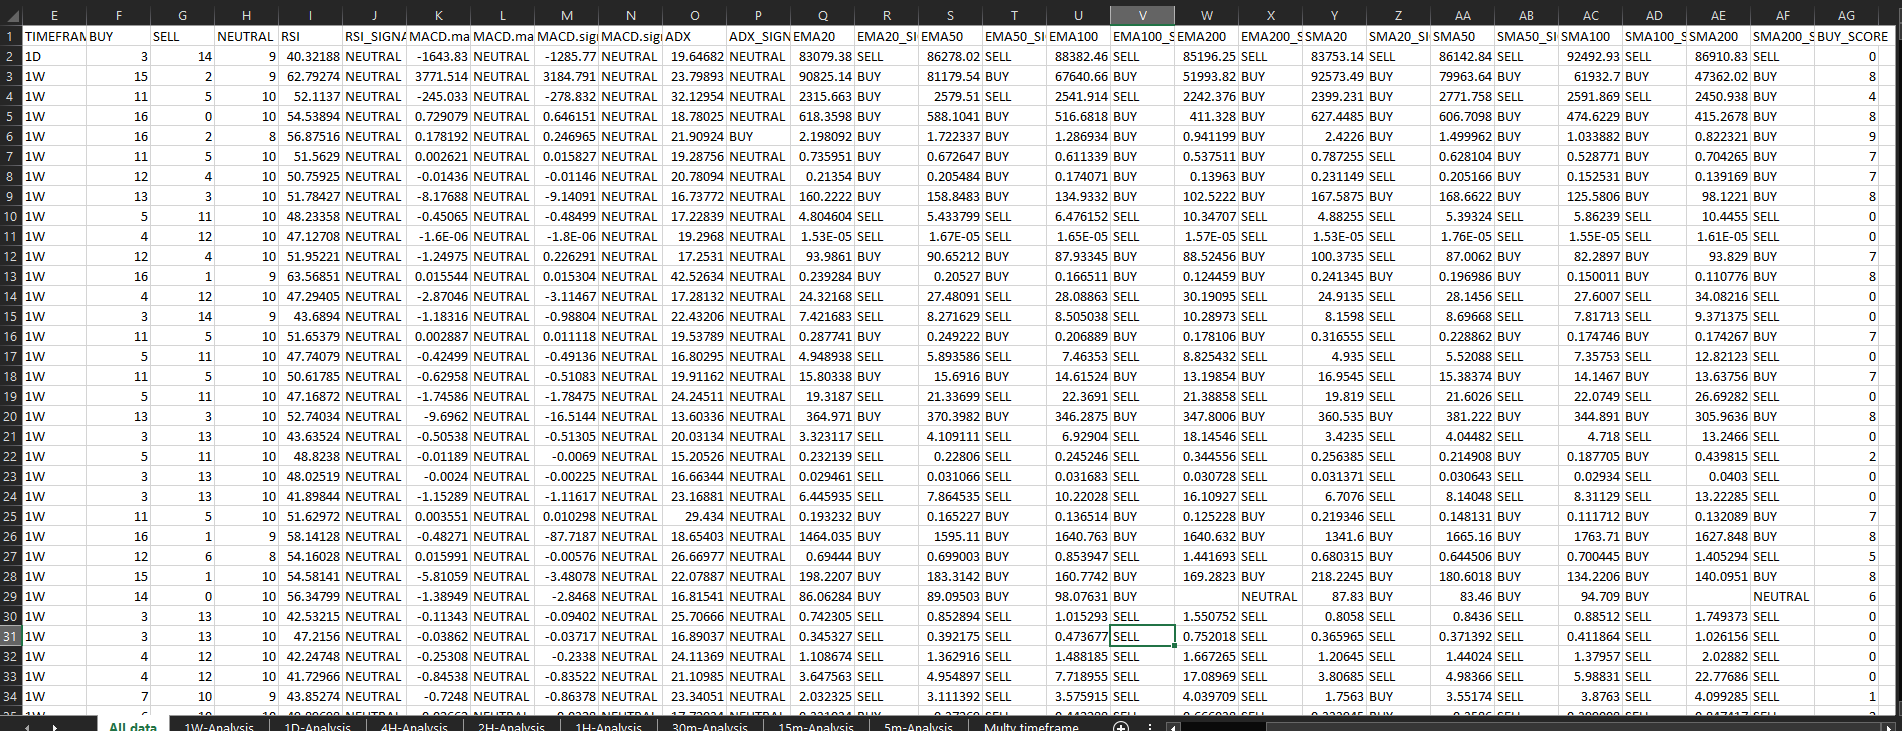
2. I used this code to extract data and collect it in an Excel file to be analysed later. I extracted data in seperate sheets for different timeframes and have set the code to keep storing the data later in 1 sheet called ALL DATA before it overwrites the old data with the new every time the code runs.
3. Then with the help of excel formulas I have extracted data for each symbol from all the sheets using VLOOKUP and add them to a sheet called MULTI TIMEFRAME where there is a summary of the reccommendations of all the timeframes. I also set an excel macro that runs every time the code runs so that it keeps adding the MULTI TIMEFRAME data to a table that collects all of it so i can analyse it later and make sure the data gives me better reccommendations.
4. I have decided to use 10 indicators that are the most used by traders, so they could be the most reliable since the majority of traders look at them to make entrys and exits from positions. These are MACD, ADX, RSI, EMAs and SMAs. I have made a seperate column (MAIN INDICATOR SUM) that sums up all the BUY reccommendations on all timeframes for these top 10 indicators, to see which is the current best option to buy.
5. Every time the code runs it is also set to send me the multy timeframe dataframe to my e-mail address along with the excel file where the data is stored. This way I can leave the house and keep being updated on my email on what is going on. The excel file quite quickly got too big for being sent in email so i just used google drive instead to have access to the files at all times.
6. The strategy of just using the reccomendations the tradingview_ta provides has proven to be inefective. This is due to how some of the reccomendations based on the indicators are calculated, so I will have to use a different strategy.
7. I have tried to use the RSI indicator for a new strategy that has ended up being more promising. I used excel to look at each symbols RSI on different timeframes, and the ones that will have the most timeframes with high RSI (above 70) or low RSI (bellow 30) will be pushed to the top. The dataframe sent to my email will have these symbols at the top, so I can check to see if there are any good positions to open.
8. I ended up adding a lot more symbols to my code to scrape data for and I made the code a lot faster by making it use more of my CPU, bringing it down from 4,30 minutes to 1,10 minutes to run once. This brought me to a big problem. I was making way too many requests per minute, so my code started erroring out. I should be allowed to make around 60 requests per minute but i ended up making hundreds more. So to make the code work for what I want I will need to make it considerably slower. Since the whole point for me is to make it as fast as possible I will need to use an API that allows this speed.
CONCLUSION: I would call this project a success as I have built exactly what I set out to build. I have run analysis on the data to see what I need and will be able to build the next one faster and more efficient. Unfortunately it is also a failure as I am not able to use it how I want to and I need to start over with a different code. I am happy with how the project turned out, this was my first big project and I am proud with what I was able to build. Now on to the next one.
CLICK TO HEAD TO MY NEXT INDICATOR ANALYSIS PROJECT.