Is investing in solar panels worth it in Europe? This analysis combines climate data, electricity pricing, and installation costs across 41 European countries to identify which markets offer the strongest ROI. Using PVGIS performance simulations, Eurostat pricing data, and financial modeling, the project reveals where solar investments deliver the best returns and provides data-driven insights for both consumers and investors evaluating the European solar market.
Goal: Determine financial viability and regional profitability of residential solar panel investments across Europe.
Tech stack – Python · PostgreSQL · SQL · Power BI · DAX
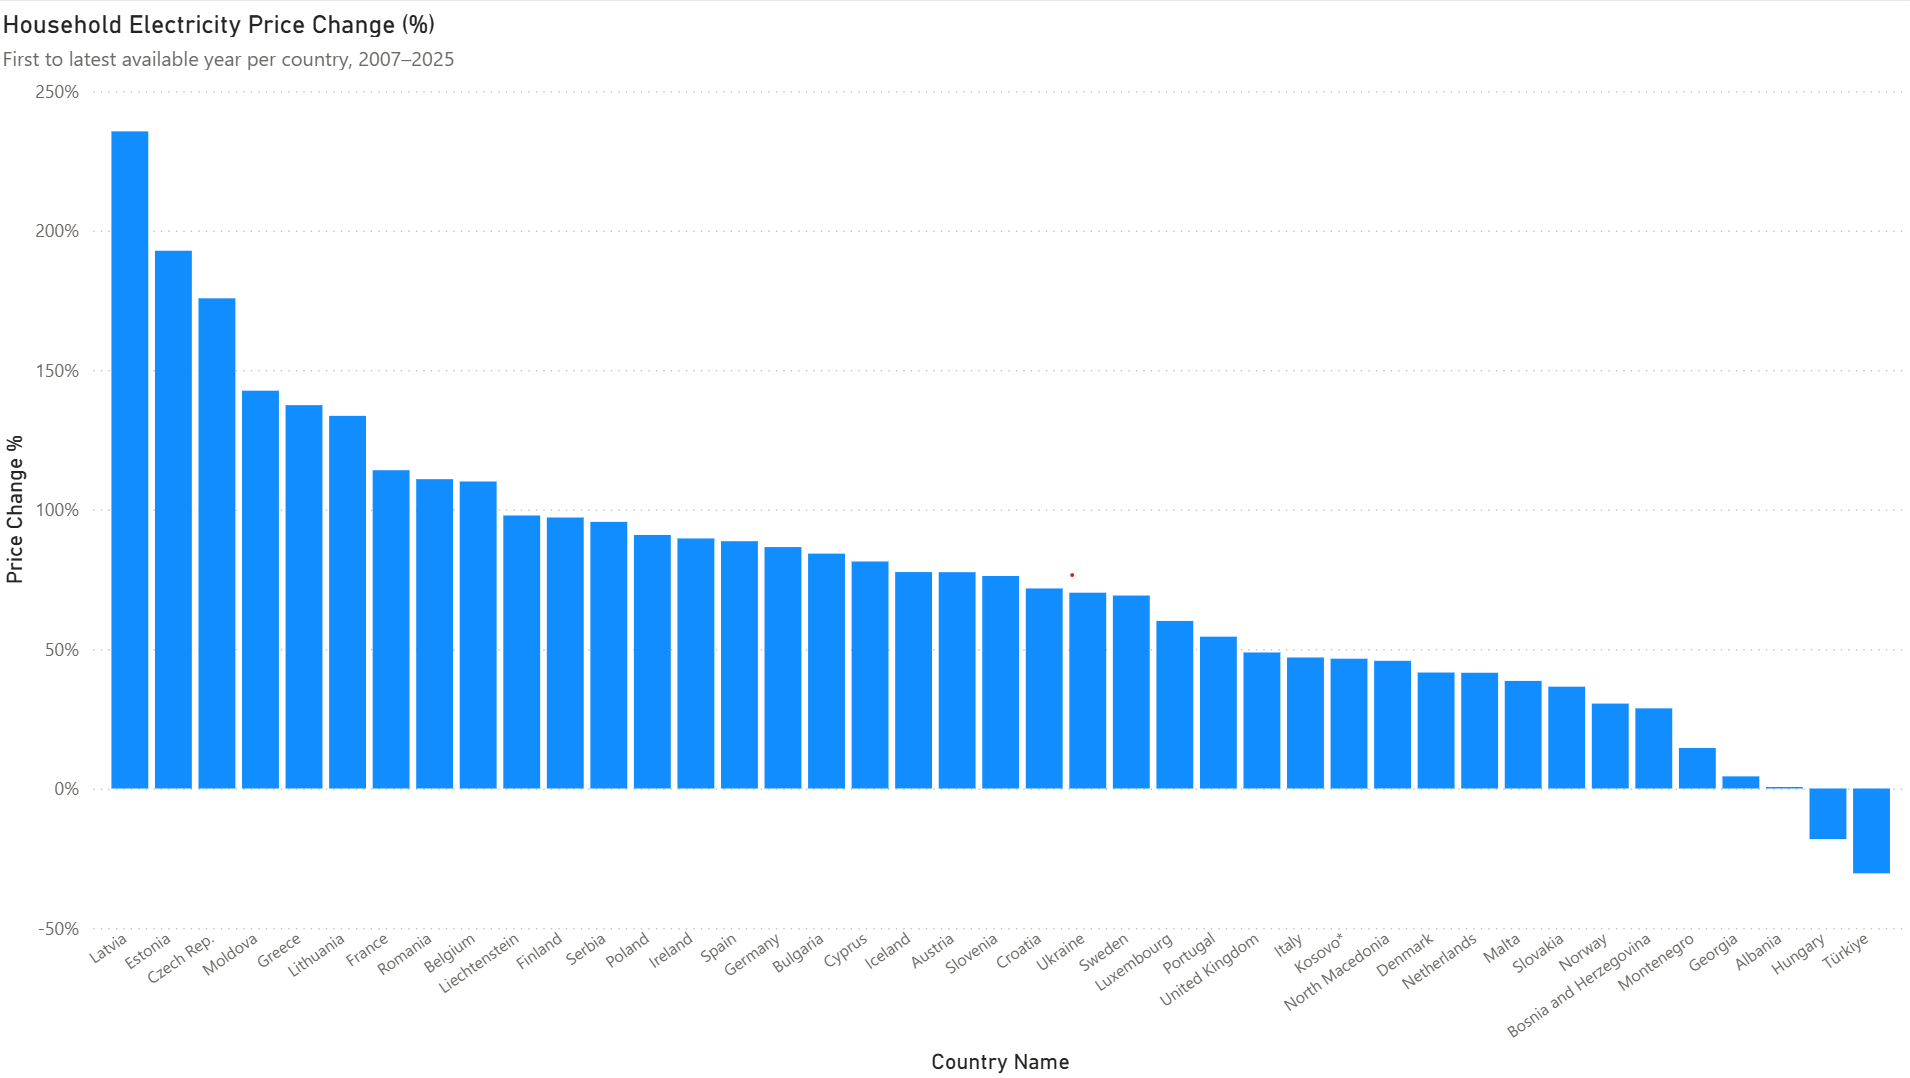
1. Electricity prices across Europe have risen sharply Over the past 20 years, household electricity prices climbed in almost every country in the dataset — by as much as 235% in some markets. Hungary and Turkey are the notable exceptions, where prices actually fell over the period.
Note: Price change is calculated from each country’s first available year to 2025. Countries with data starting after 2007 (Italy 2008, Bosnia and Herzegovina 2010, Montenegro 2011, Albania 2011, Iceland 2012, North Macedonia 2012, Kosovo 2013, Serbia 2013, Liechtenstein 2014, Moldova 2015, Ukraine 2016, Georgia 2018) show change from their earliest data point, not from 2007. This affects the magnitude of their percentage changes.
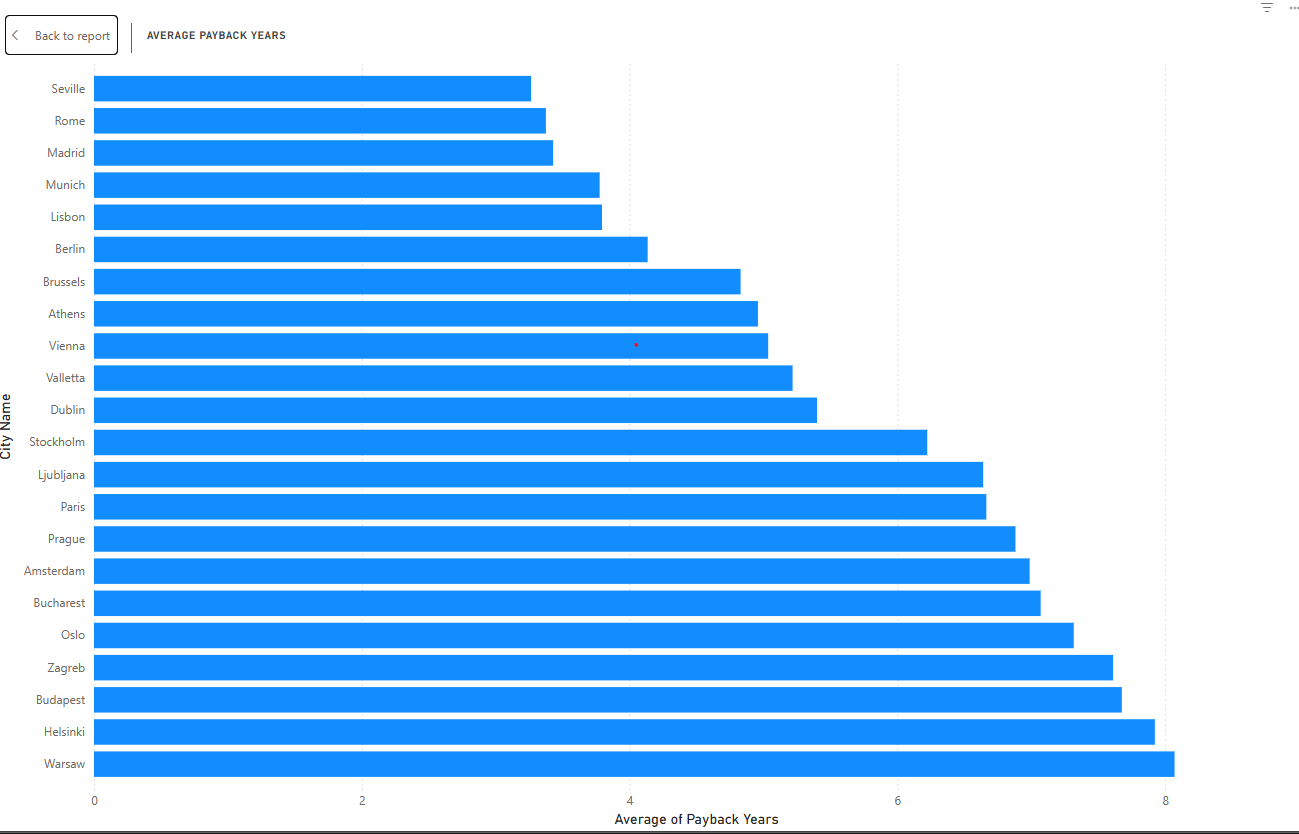
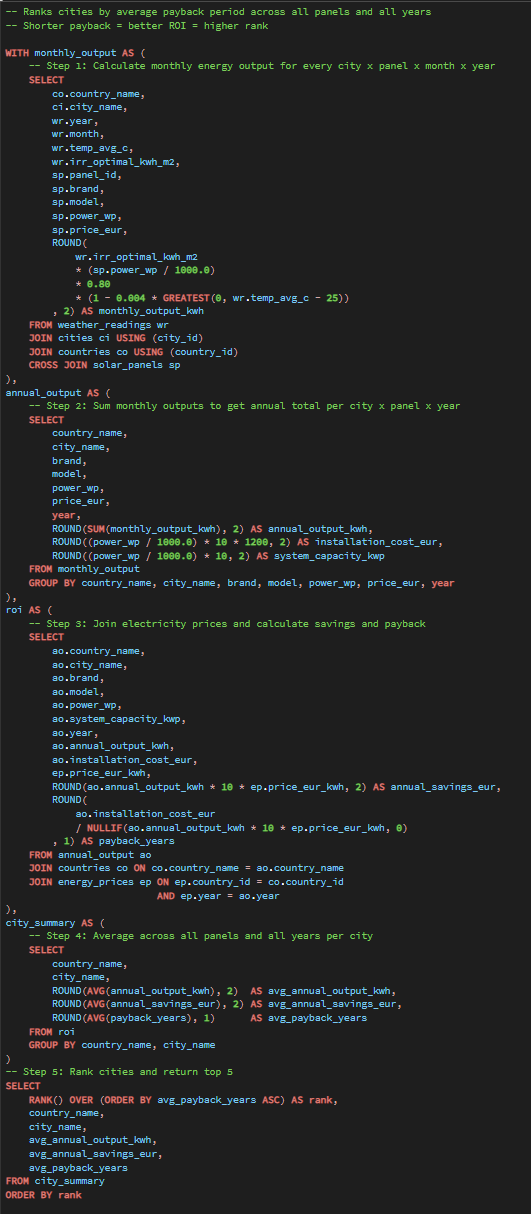
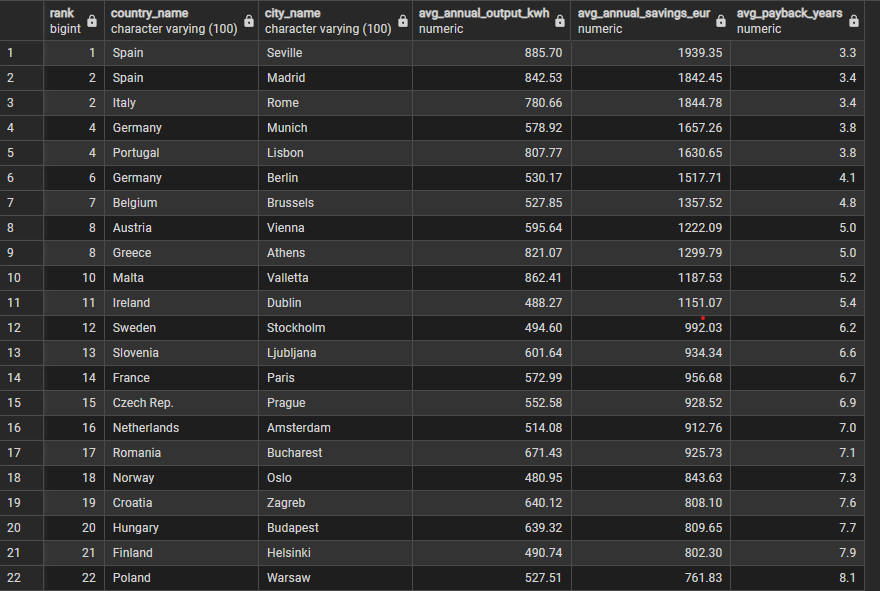
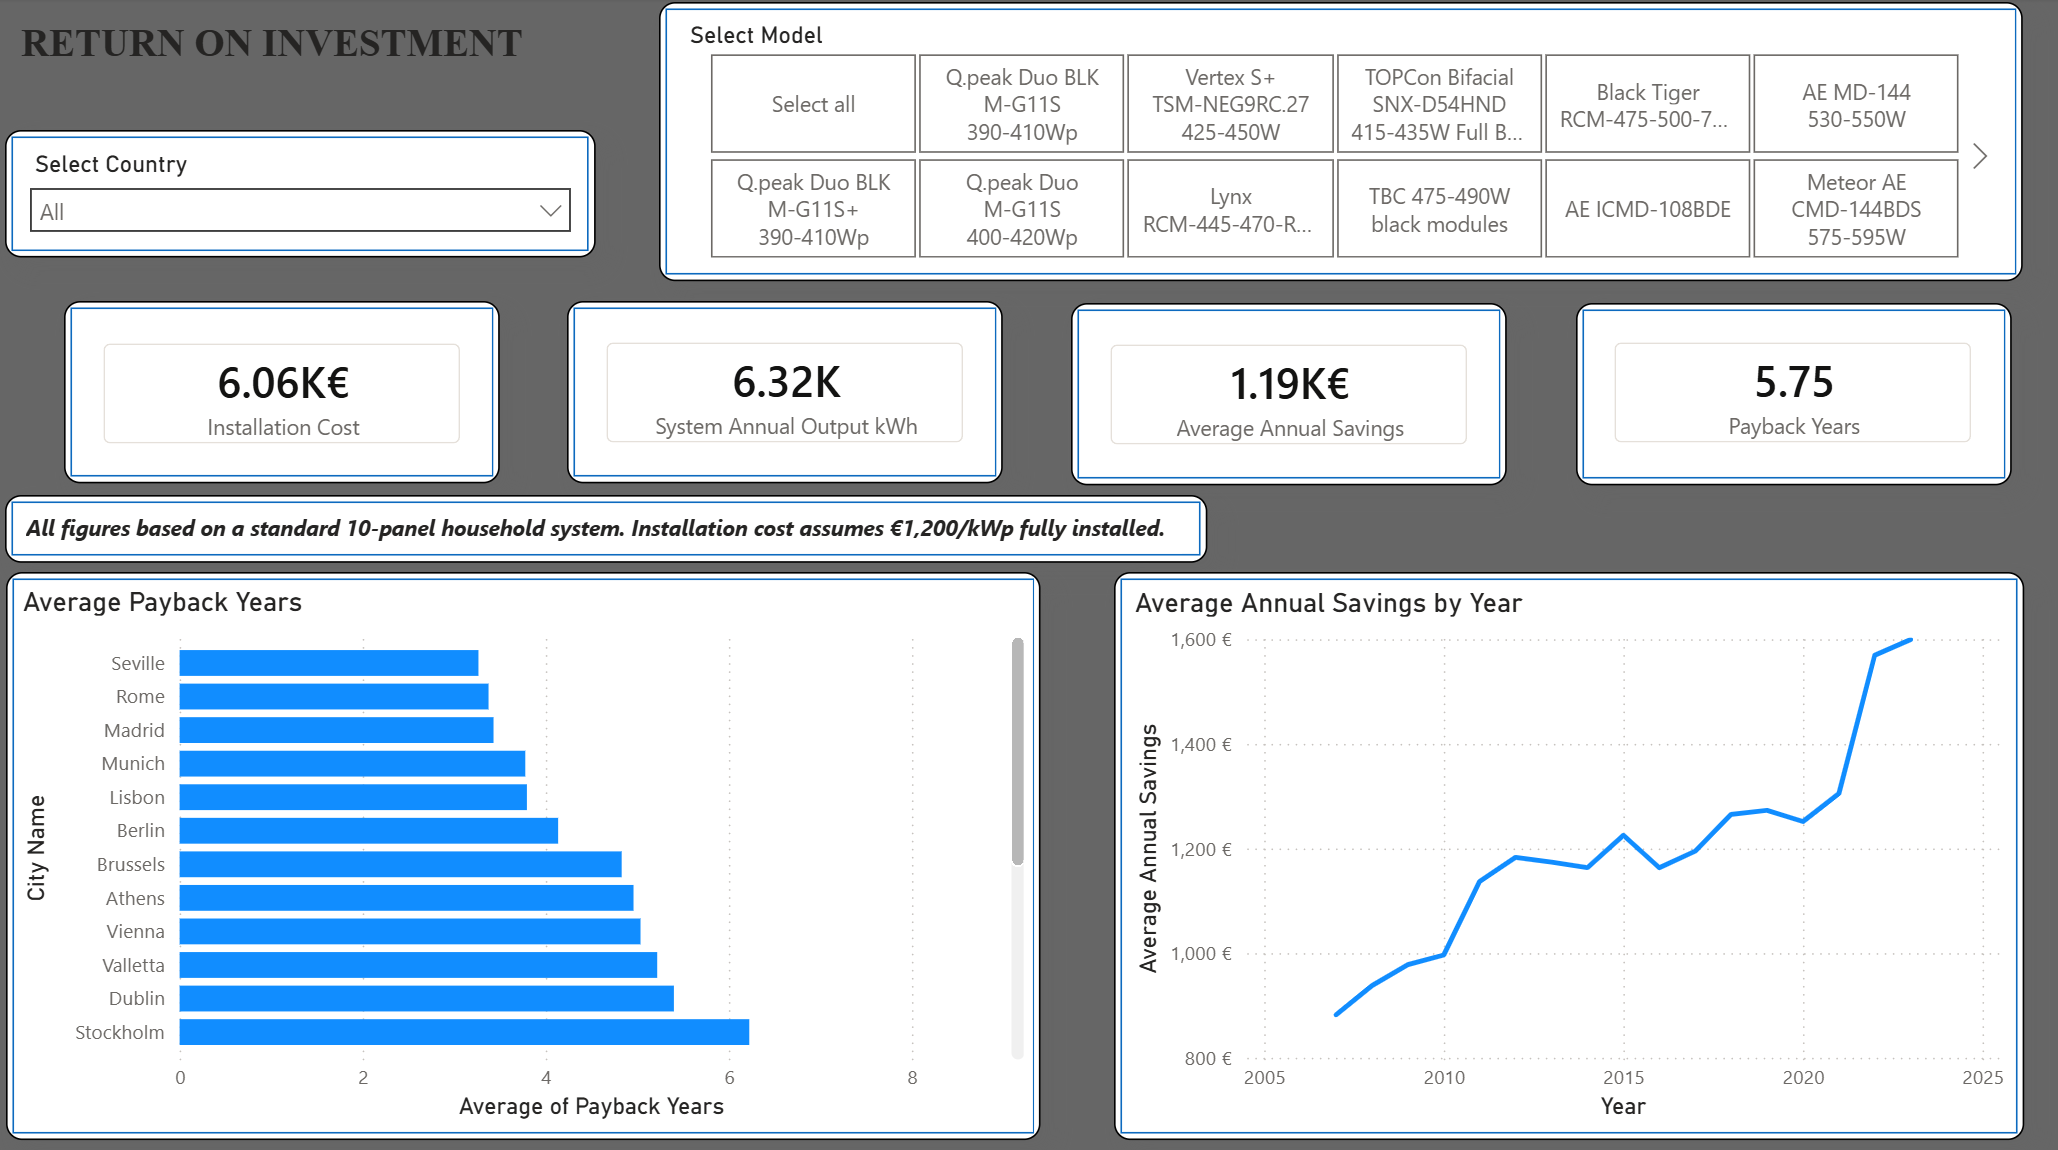
2. Sunshine isn’t what drives ROI — electricity prices are The five cities with the fastest payback are Seville, Rome, Madrid, Munich, and Lisbon. Munich outranking Lisbon and Athens is the most counterintuitive result in the analysis: Germany receives significantly less solar irradiance, but its high electricity prices mean each generated kWh displaces a more expensive unit from the grid. Solar ROI is a function of what you’re avoiding paying, not just how much sun you get.
3. Payback periods range from 3 to 8 years The spread is driven by three variables: solar irradiance, system output per country, and local electricity prices.
Fastest payback: Seville, Rome, Madrid, Munich, Lisbon. Slowest payback: Warsaw, Helsinki, Budapest, Zagreb, Oslo — all in the 7–8 year range.
The slow group splits into two distinct causes. Helsinki and Oslo simply don’t receive enough sun. Warsaw, Budapest, and Zagreb do — their problem is cheap electricity, which leaves less cost to avoid per kWh generated. Two different roads to the same result.
Neighbours with different answers
Slovenia (6–7 years) pays back noticeably faster than Hungary (7–8 years), despite the two sharing a border and near-identical solar conditions. Geography can’t explain the gap — electricity prices can. Hungary is one of only two markets in the dataset where household electricity prices fell over the 20-year window, and that cheap power is exactly what makes solar less compelling there.
It’s the Munich–Lisbon finding again, at a smaller scale: two locations with the same sun, ranked by their electricity bills.
Even so, the entire range sits well inside a typical 25-year panel warranty. There is no market in this dataset where solar fails to pay for itself several times over.
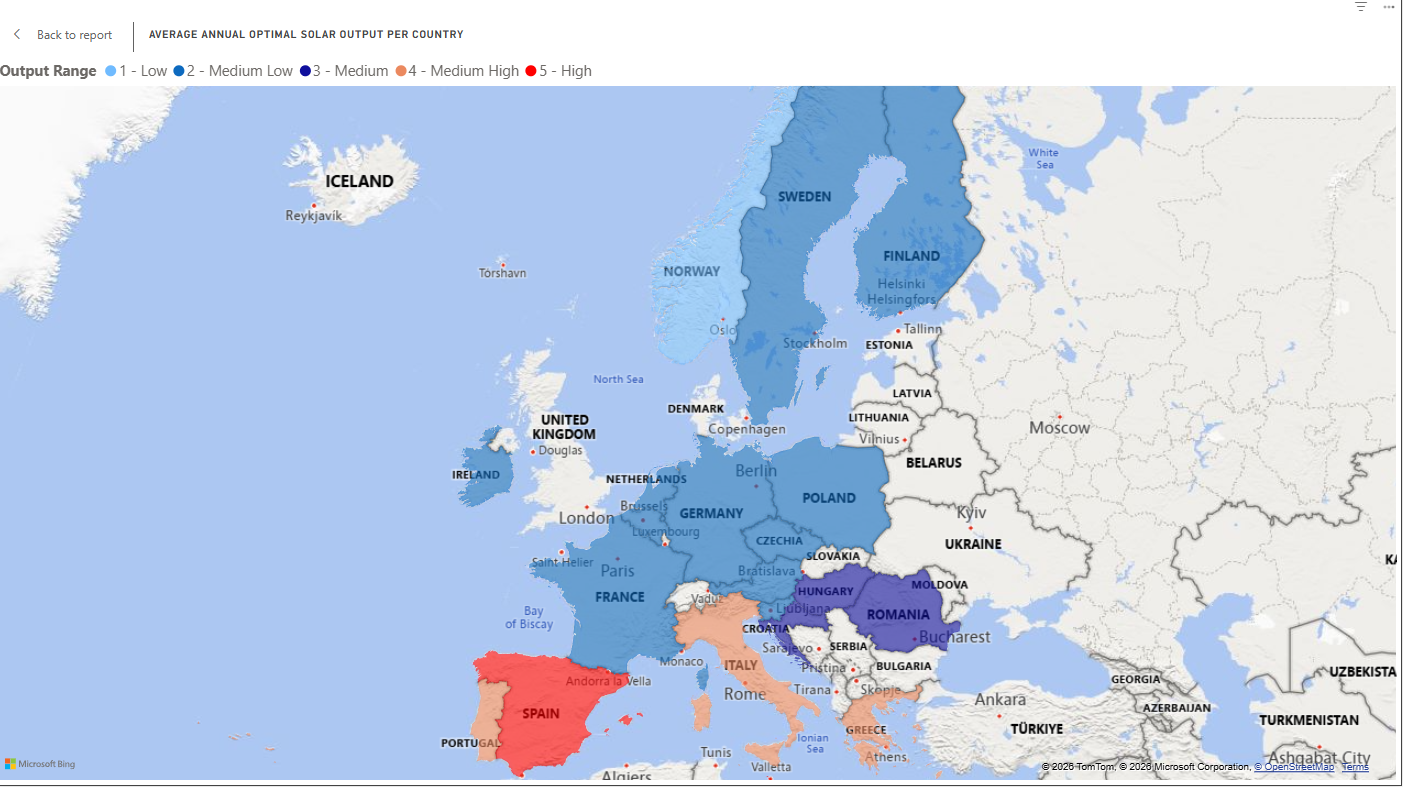
4. Solar output follows geography, ROI does not Highest annual output: Seville, Valletta, Madrid, Athens, Lisbon. Lowest annual output: Oslo, Dublin, Helsinki, Stockholm, Amsterdam. Comparing this list against the ROI ranking shows the gap between raw generation potential and financial return.
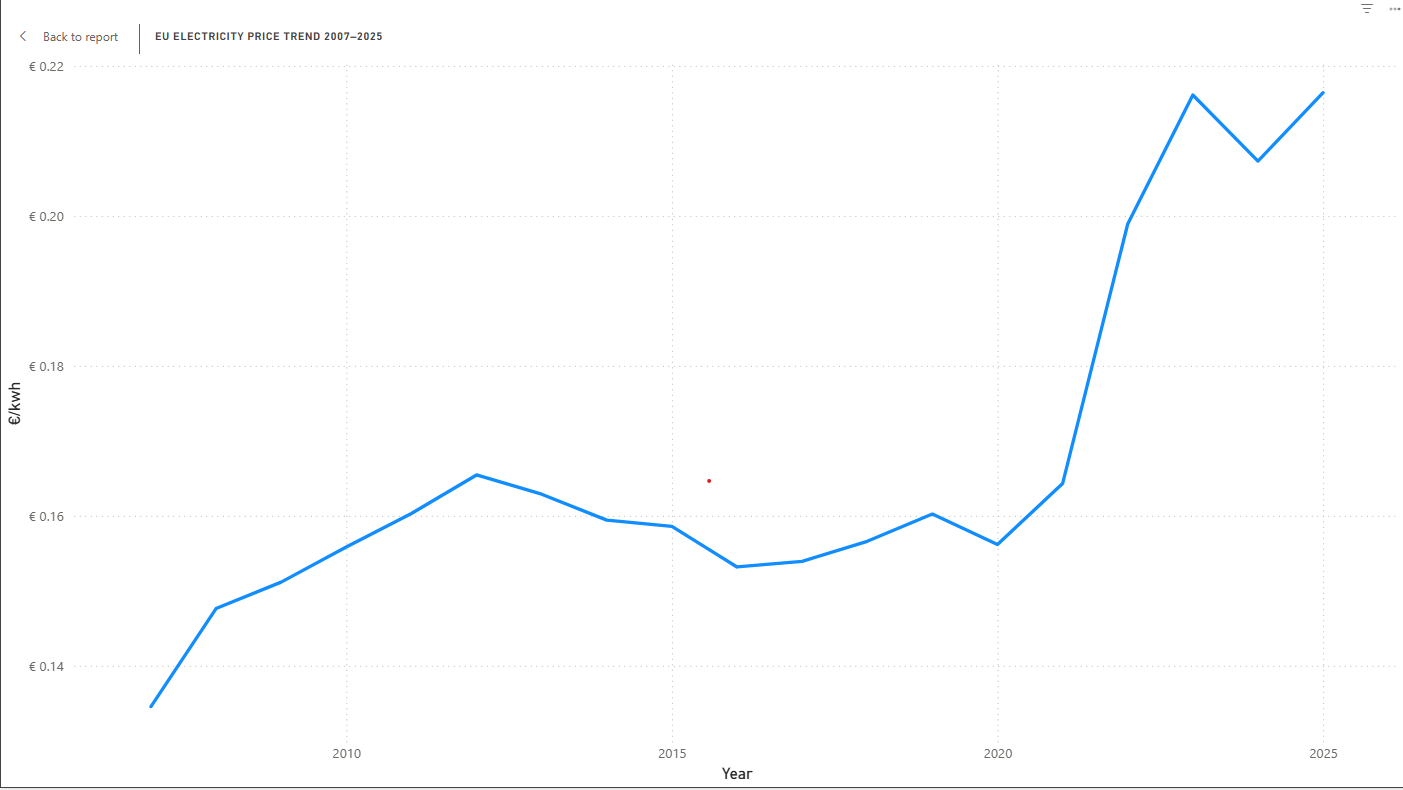
5. The trend line points one way Unless you expect electricity to start getting cheaper, solar looks like an attractive investment across the board. Every payback figure here is calculated against today’s prices — and 20 years of data suggests today’s prices are the cheapest they’re going to be. Rising electricity costs shorten every payback period in this analysis.
ASSUMPTIONS AND LIMITATIONS
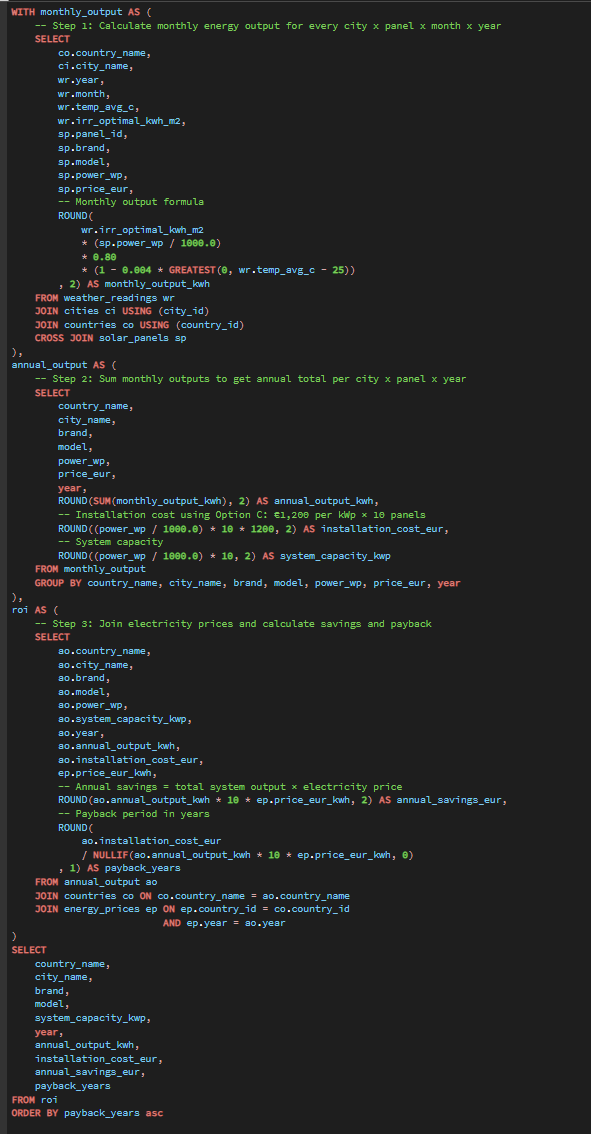
Installation cost is held constant across all countries at €1,200/kWp — the 2024 European average fully-installed cost, covering panels, inverter, mounting, wiring, labour, and permits. This isolates irradiance and electricity price as the variables under study. Real-world costs vary by 20–40% between European markets, which would shift absolute payback figures but is unlikely to reorder the top-performing cities.
Panel degradation (~0.5%/year) is not modelled.
Future electricity price changes are not modelled — all payback figures use current prices.
METHODOLOGY
Data sources
Source
What it provides
PVGIS (EU Joint Research Centre)
Solar irradiance and simulated panel output by location. 2005 – 2023
Eurostat
Household electricity prices, 2007–2025, Band DC (2,500–4,999 kWh/year), all taxes and levies included
ENF Solar
Panel specifications — power rating, efficiency, manufacturer
Pipeline
Python scripts build the schema and pull data from the PVGIS API into a PostgreSQL database, structured across six normalised tables. Analysis runs in SQL, using CTEs and then ranking cities by payback period. Power BI sits on top, reproducing the ROI logic in DAX so the results can be filtered interactively by country, panel model, and year.
A standard 10-panel residential system is modelled throughout. A 540 Wp panel gives a 5.4 kWp system at roughly €6,480 installed.
SQL QUERIES
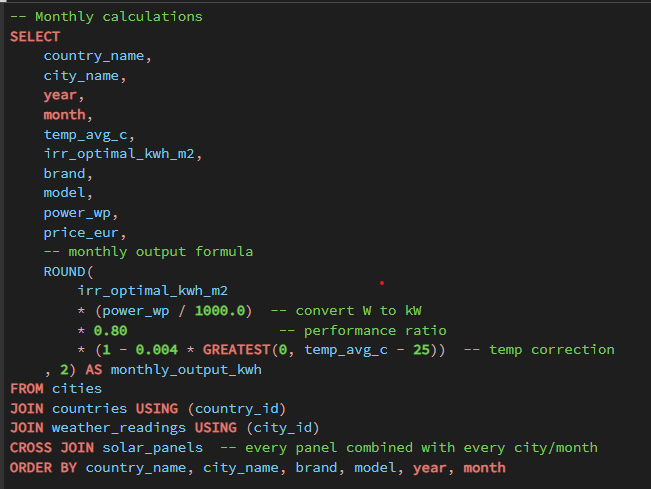
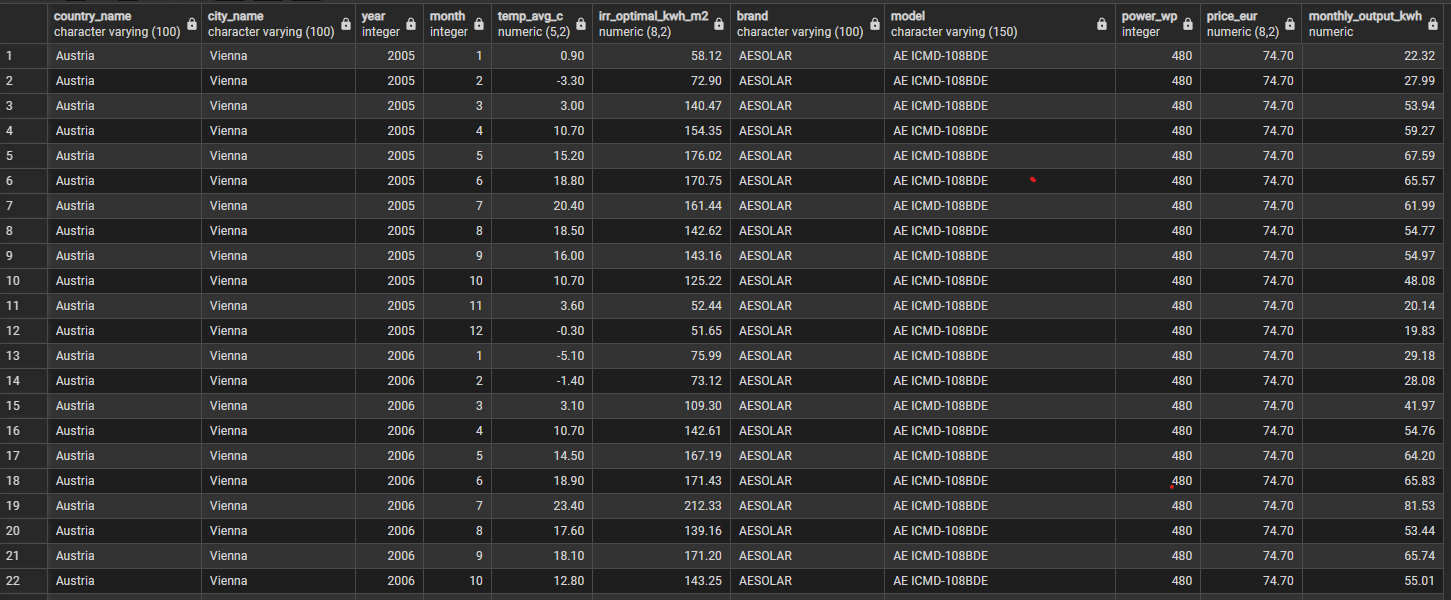
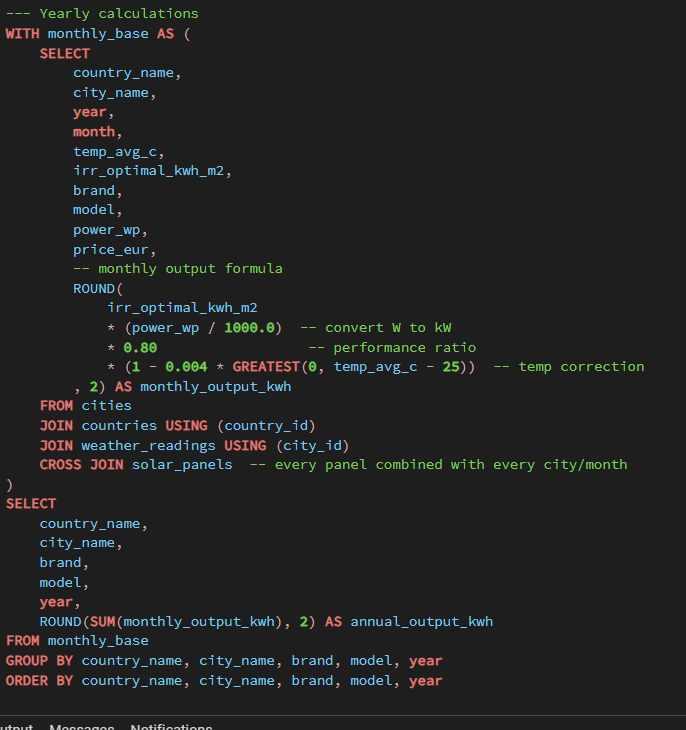
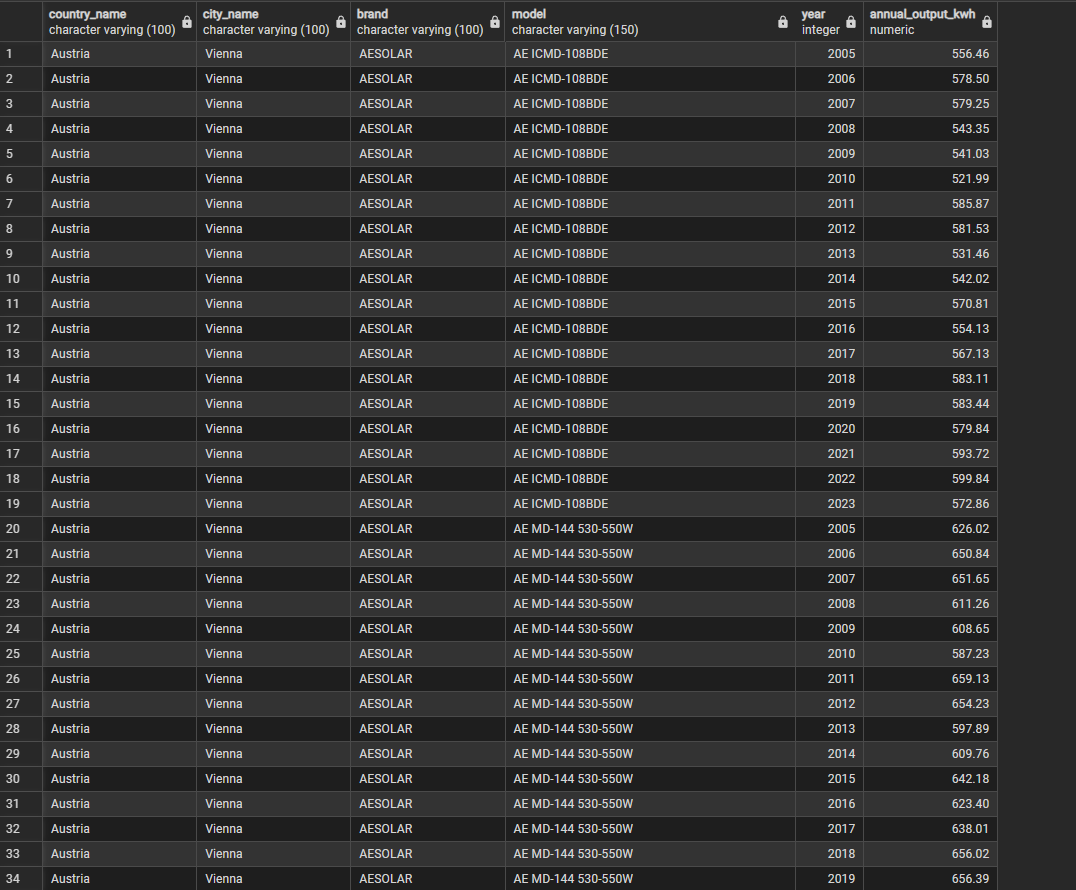
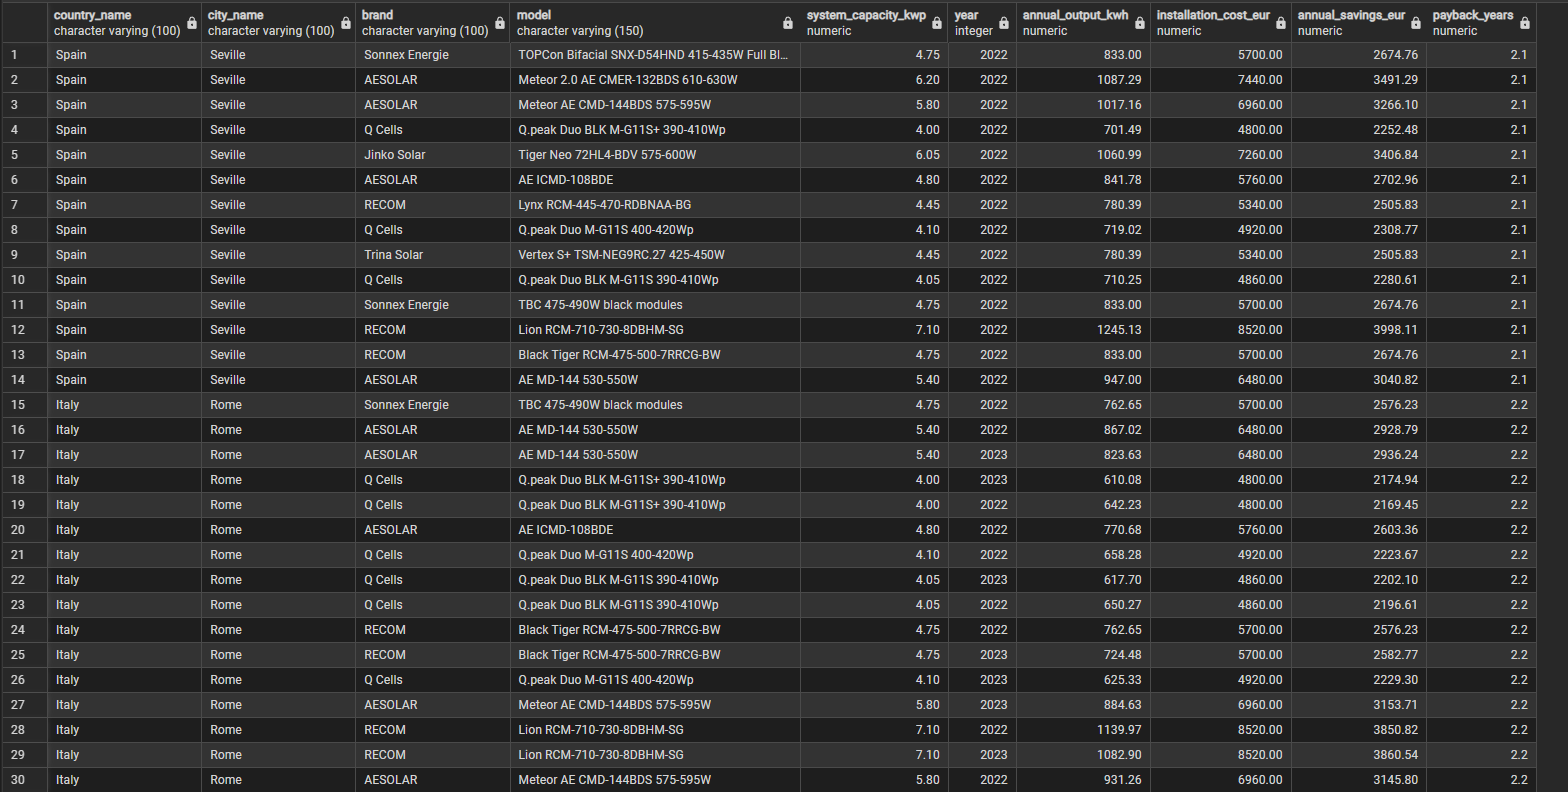
Query 1 - Monthly output per panel Query 2 - Yearly output per panel Query 3 - ROI per panel Query 4 - Average ROI per city
POWER BI DASHBOARDS
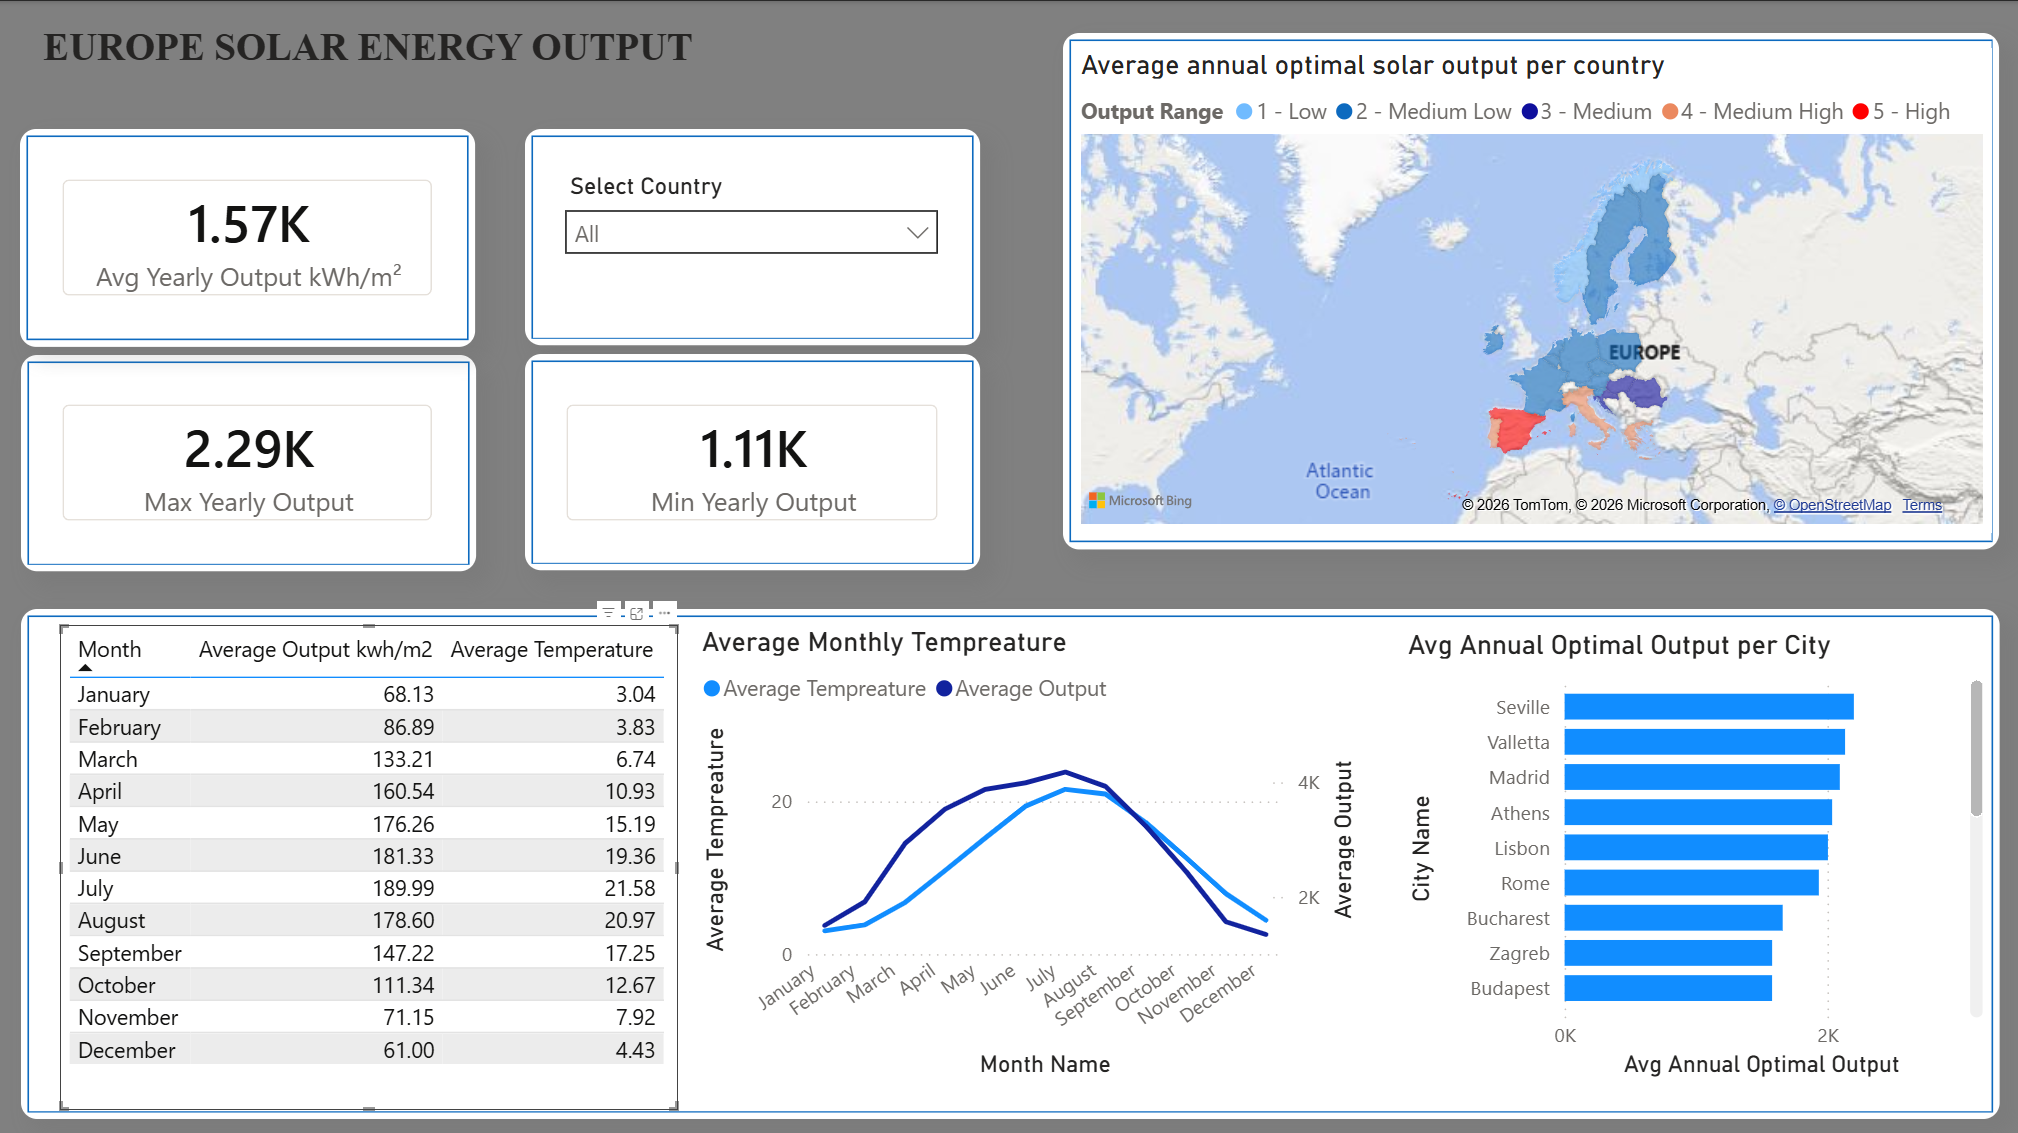
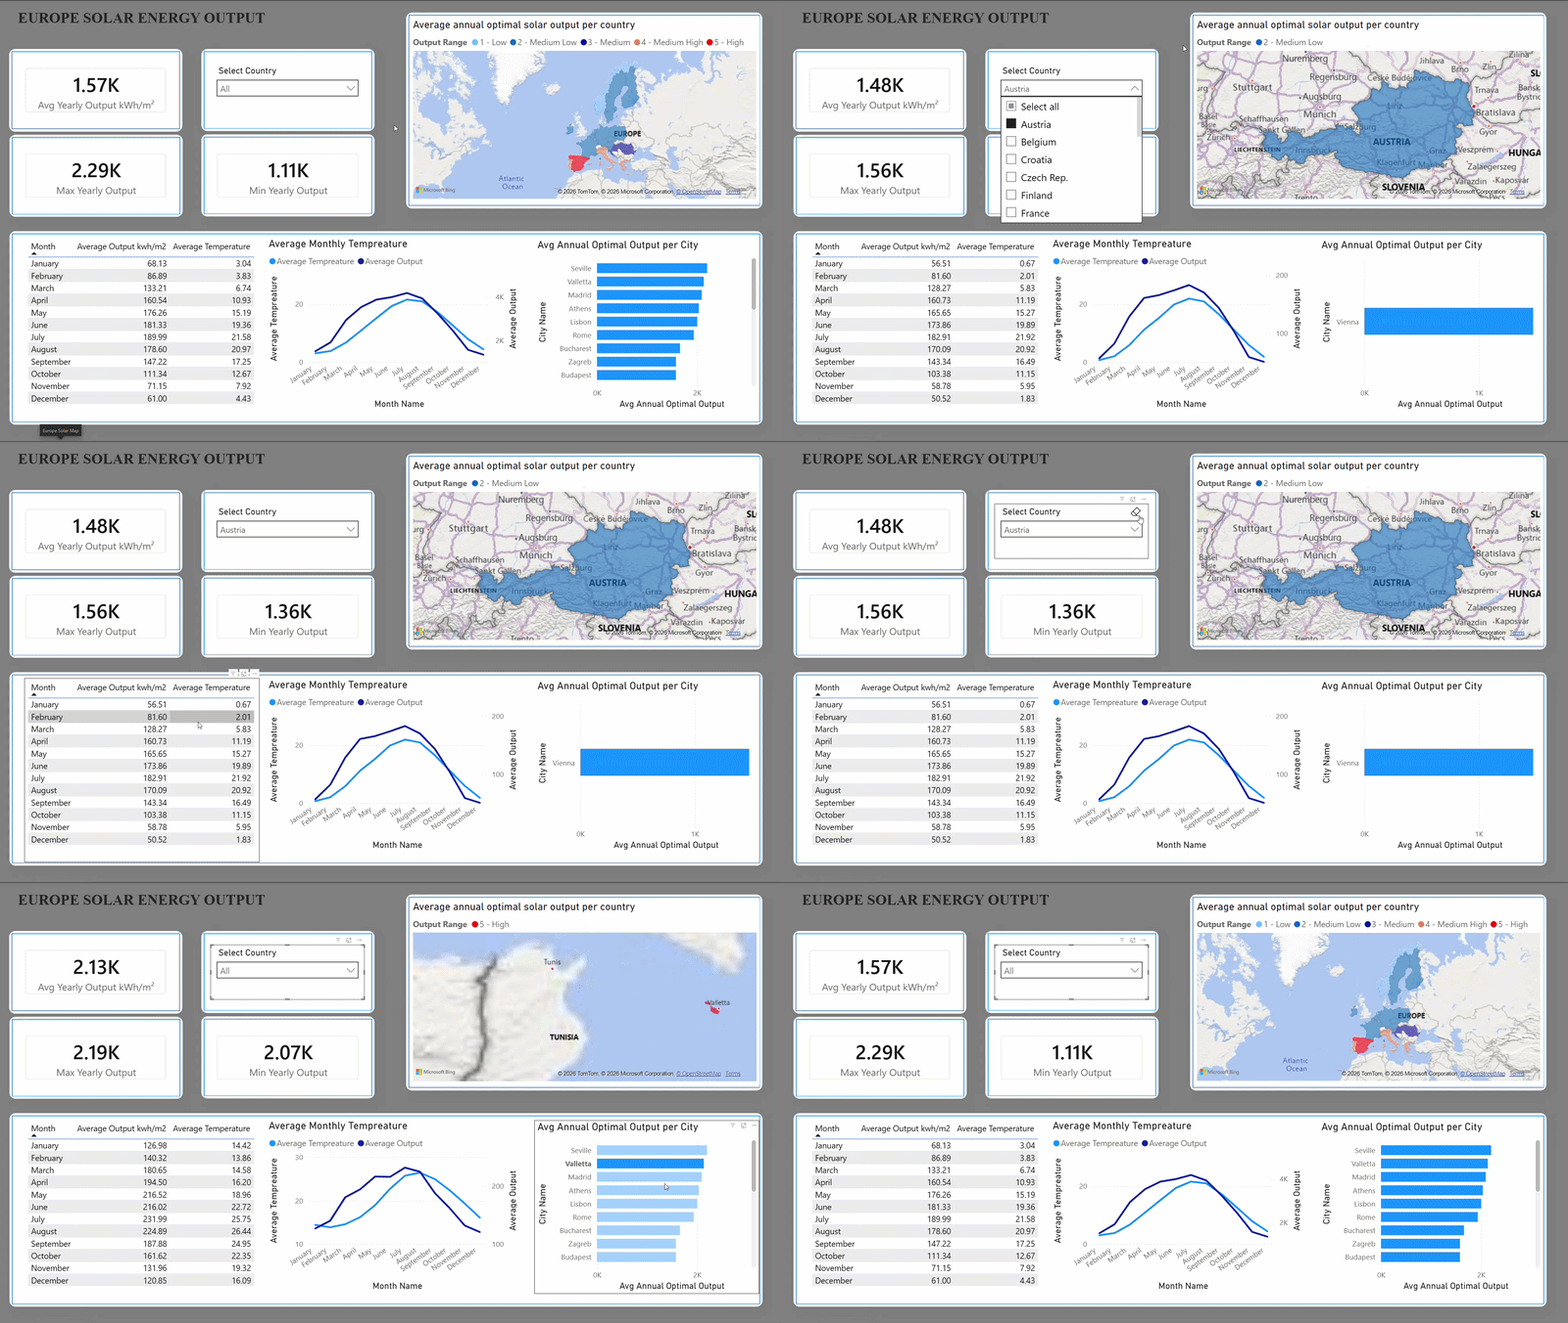
Dashboard 1: Europe Solar Energy Output
This page visualizes solar irradiance potential across 22 European cities. An interactive country slicer updates KPI cards, a heat map, and a ranked city chart showing output ranges from 1.1K to 2.3K kWh/m² annually. Seasonal patterns are clear: summer peaks at 180+ kWh/m², winter drops to 60–70 kWh/m²—revealing why geography matters for ROI.
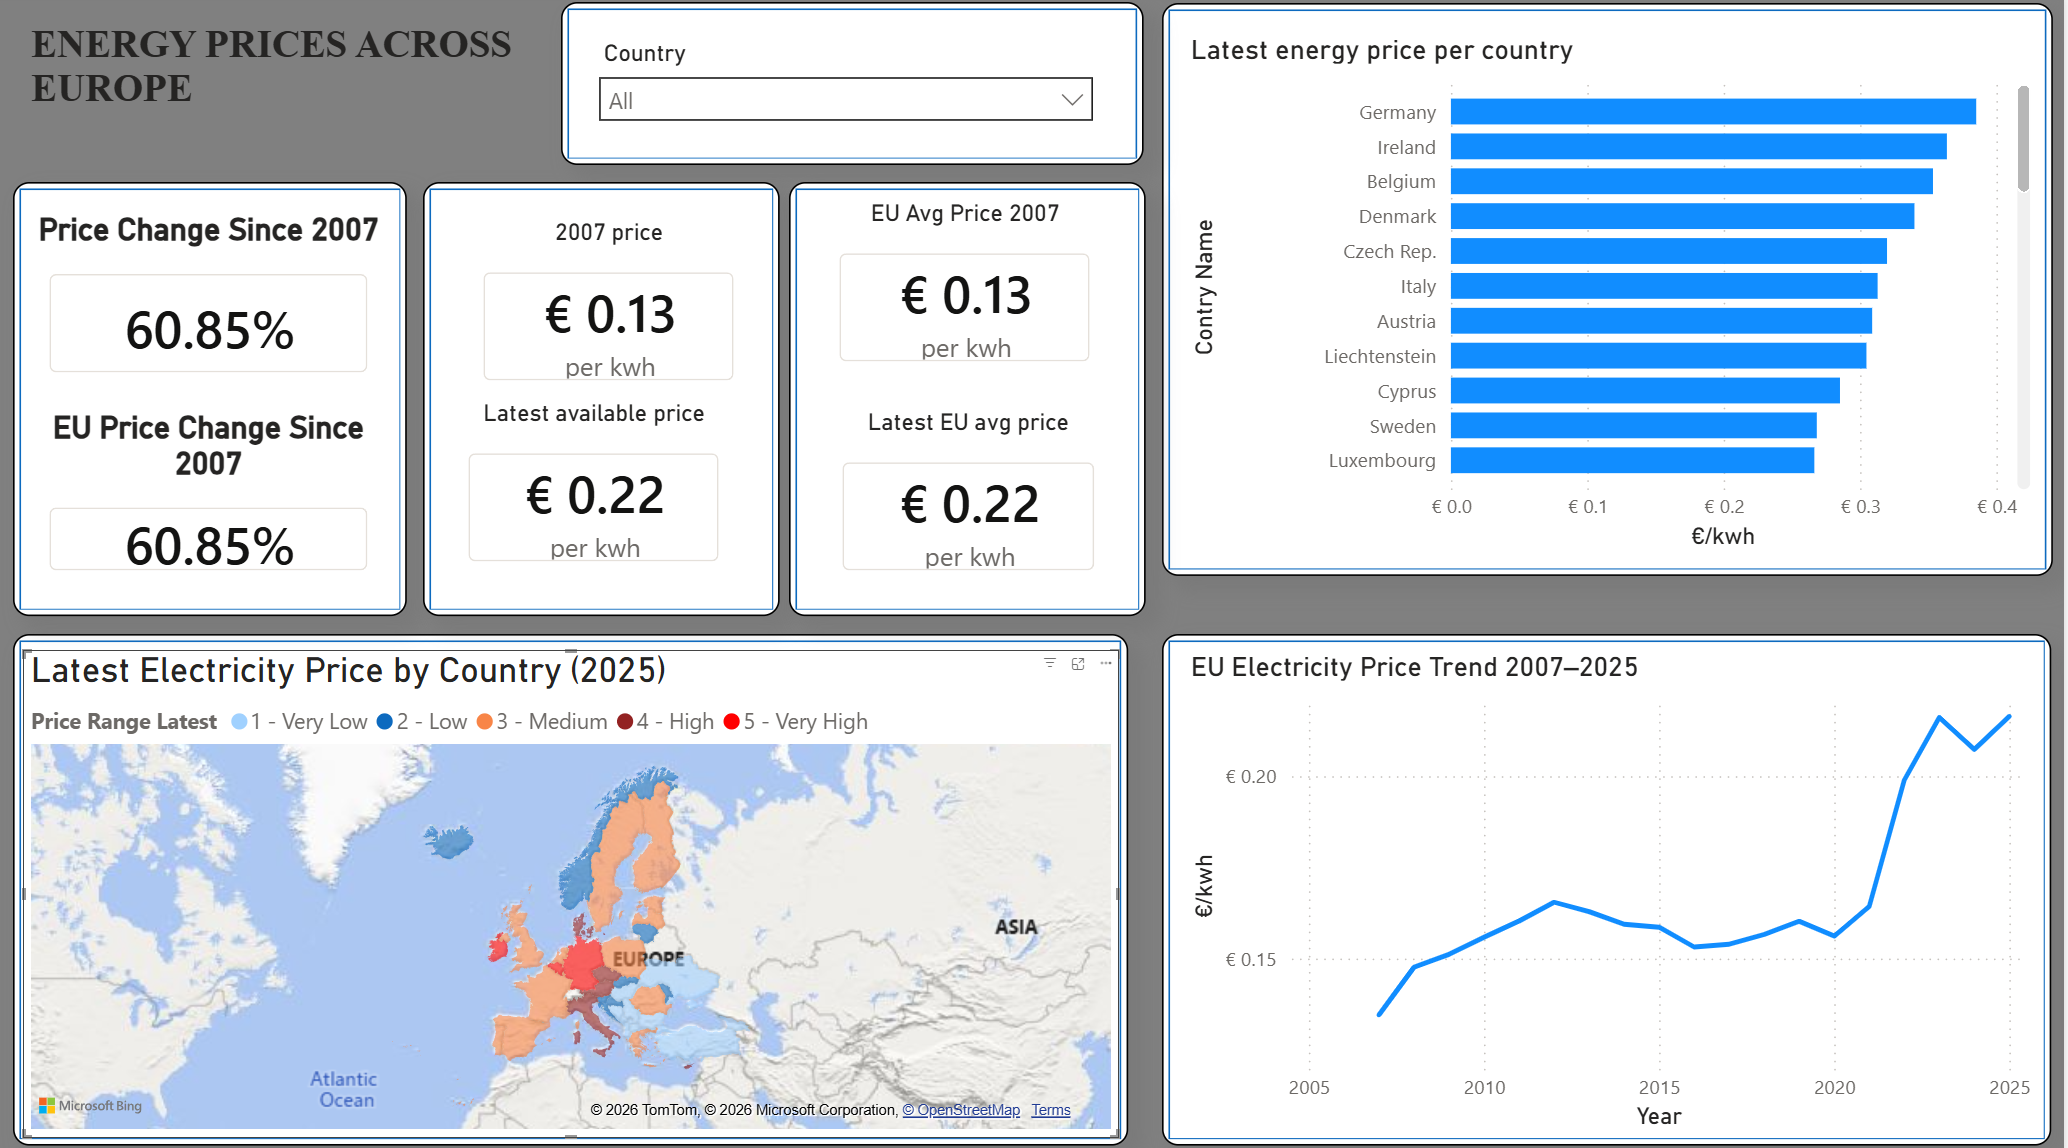
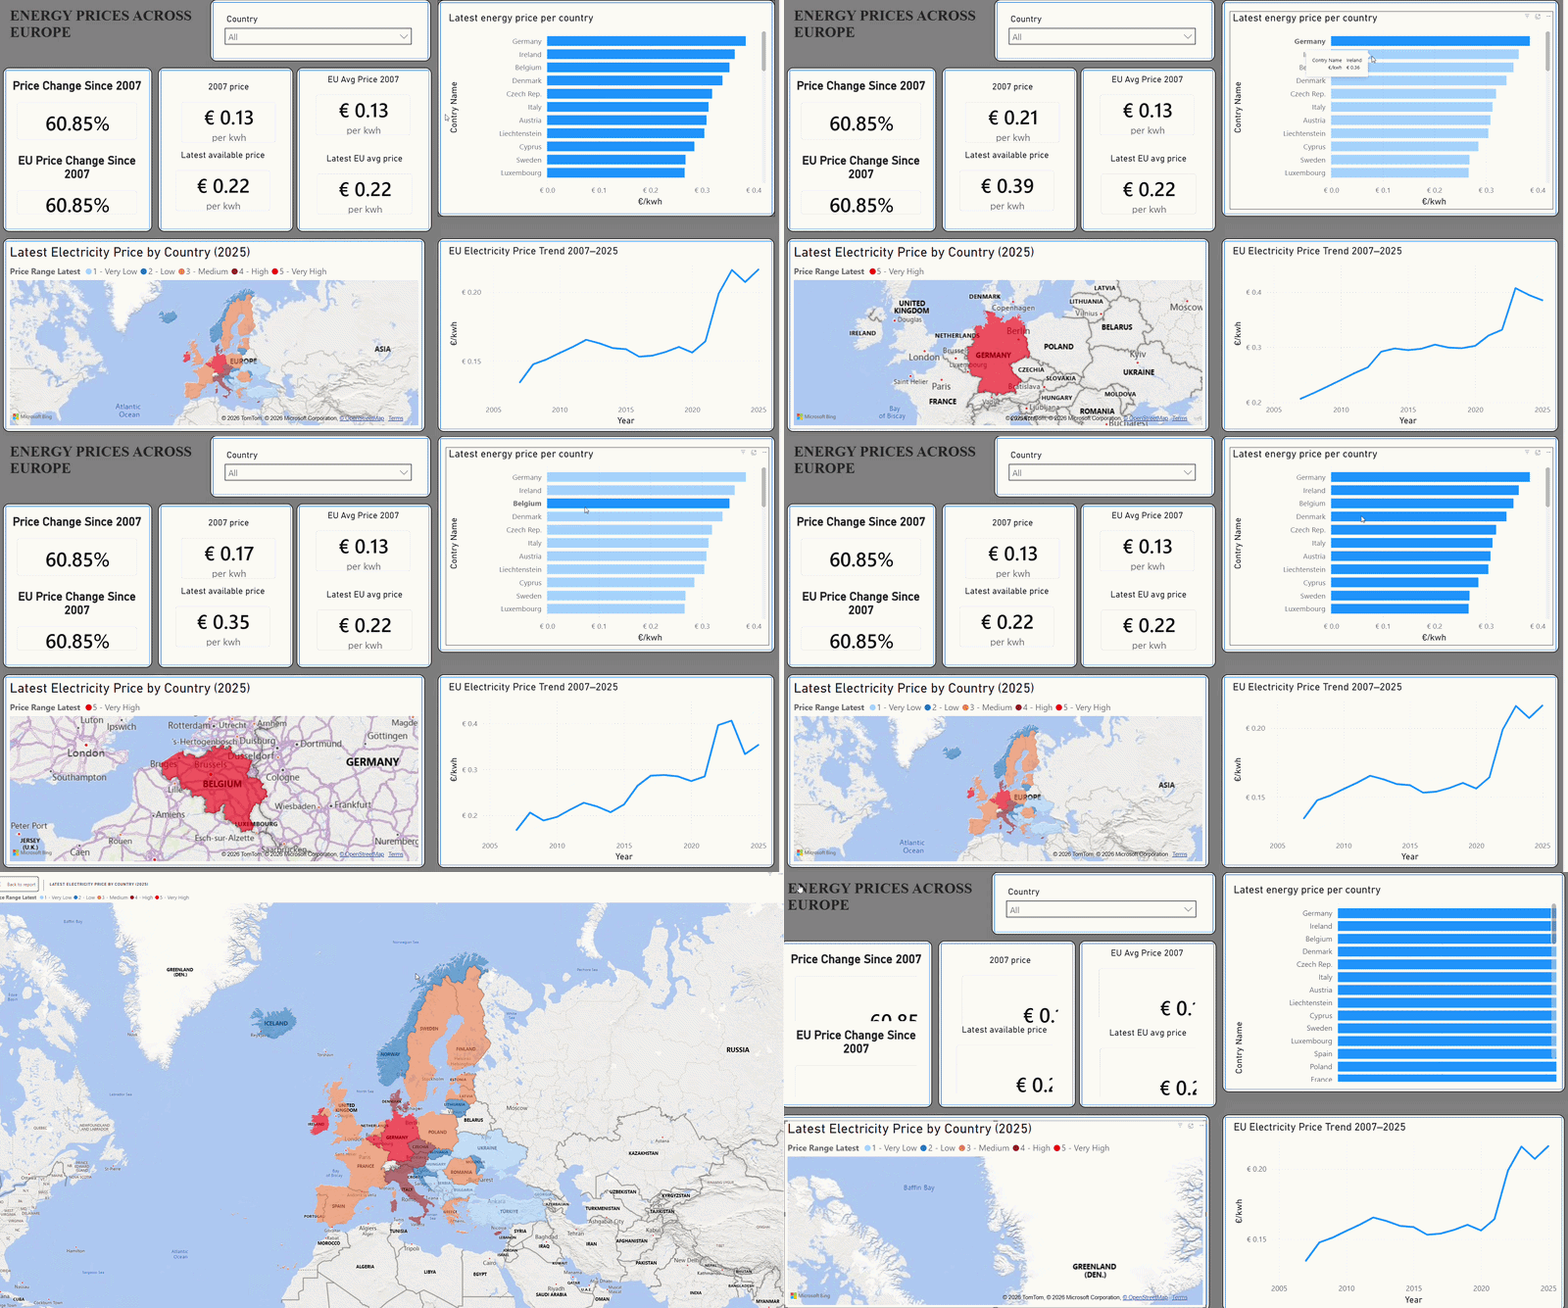
Dashboard 2: Energy Prices Across Europe
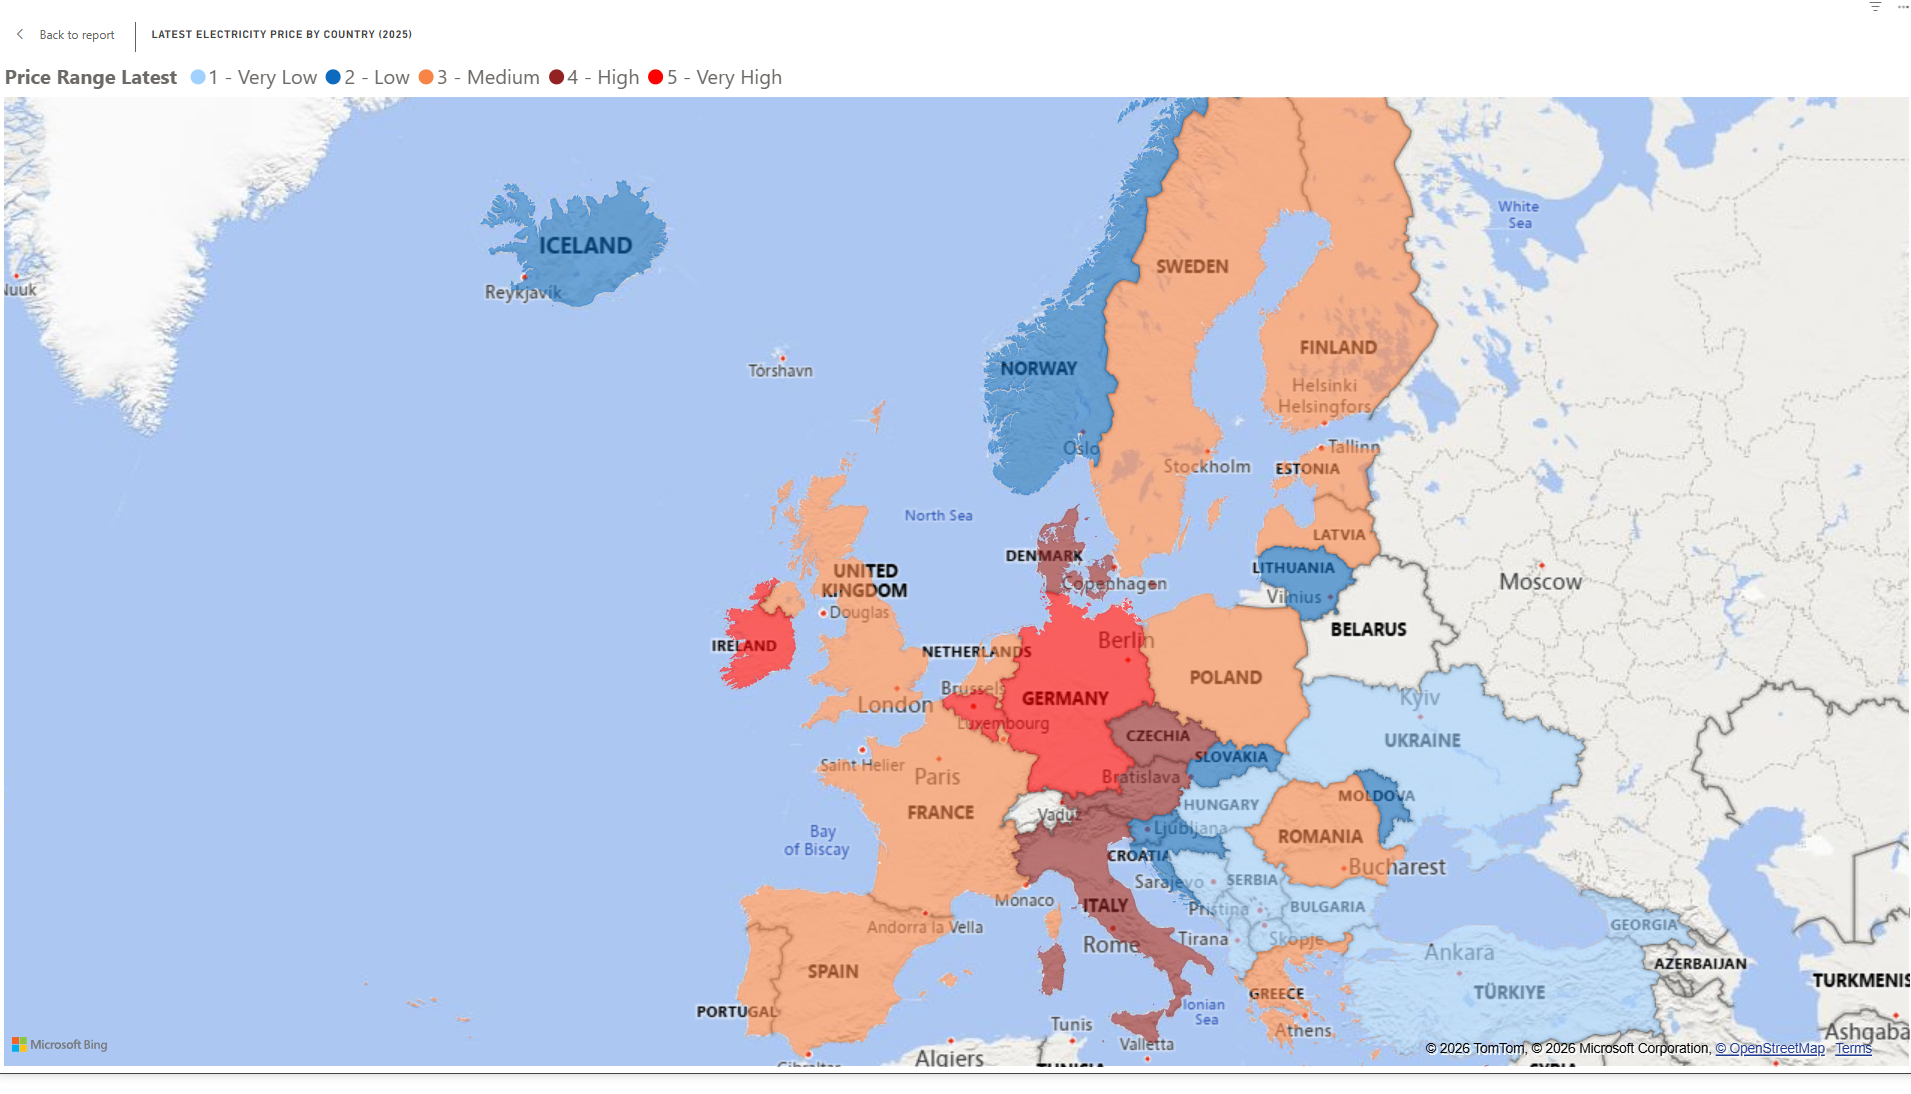
A country slicer filters KPI cards tracking current prices, 2007 baseline, and the cumulative price increase. The heat map colour-codes 41 countries by current electricity costs—Germany highest at €0.39/kWh. The bar chart ranks countries by current price. The trend line reveals the 2021–22 energy-crisis spike, the key context explaining why payback periods have compressed.
Note: Price change is calculated only for countries with continuous data from 2007; some newer entries (Albania, Ukraine, Serbia,...) lack historical baseline data.
Dashboard 3: Return on Investment
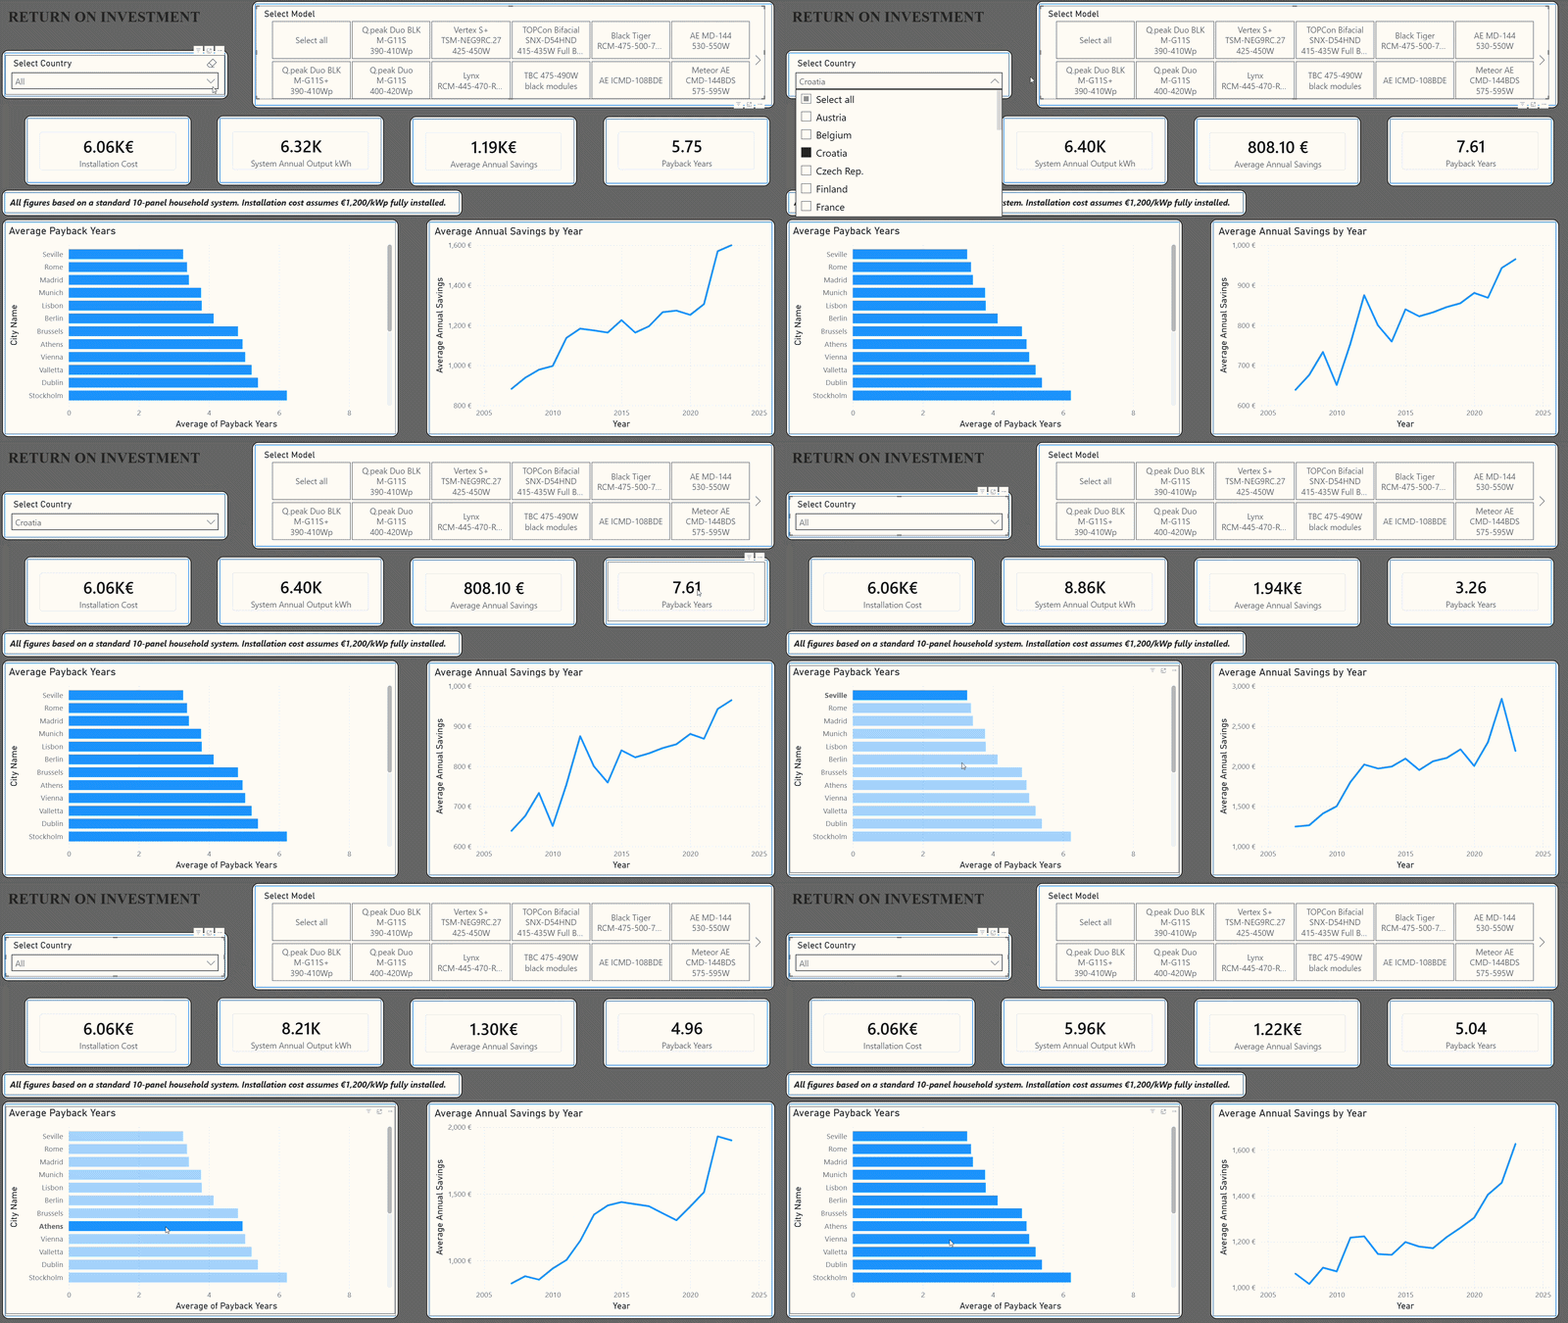
Filter by country and panel model to see real-time ROI calculations: installation cost, annual output, savings, and payback period for a 10-panel system. A city ranking chart reveals payback varies from 3 years (Seville, Rome, Madrid) to 8+ years (northern cities), while the savings trend line shows rising returns over time as electricity prices climb—making solar increasingly attractive.